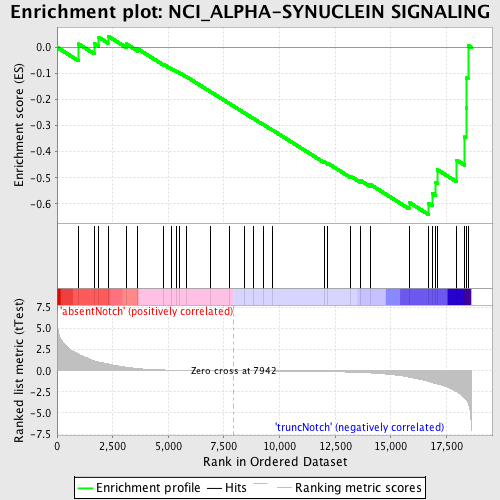
Profile of the Running ES Score & Positions of GeneSet Members on the Rank Ordered List
| Dataset | Set_03_absentNotch_versus_truncNotch.phenotype_absentNotch_versus_truncNotch.cls #absentNotch_versus_truncNotch.phenotype_absentNotch_versus_truncNotch.cls #absentNotch_versus_truncNotch_repos |
| Phenotype | phenotype_absentNotch_versus_truncNotch.cls#absentNotch_versus_truncNotch_repos |
| Upregulated in class | truncNotch |
| GeneSet | NCI_ALPHA-SYNUCLEIN SIGNALING |
| Enrichment Score (ES) | -0.6406605 |
| Normalized Enrichment Score (NES) | -1.4767032 |
| Nominal p-value | 0.01831502 |
| FDR q-value | 0.5839683 |
| FWER p-Value | 1.0 |
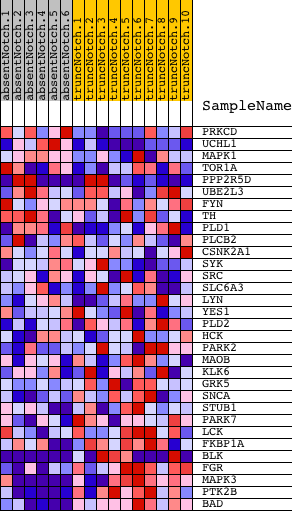
| PROBE | DESCRIPTION (from dataset) | GENE SYMBOL | GENE_TITLE | RANK IN GENE LIST | RANK METRIC SCORE | RUNNING ES | CORE ENRICHMENT | |
|---|---|---|---|---|---|---|---|---|
| 1 | PRKCD | 770592 | 966 | 1.931 | 0.0131 | No | ||
| 2 | UCHL1 | 1230066 | 1673 | 1.171 | 0.0146 | No | ||
| 3 | MAPK1 | 3190193 6200253 | 1876 | 1.029 | 0.0383 | No | ||
| 4 | TOR1A | 670139 5890288 | 2289 | 0.799 | 0.0431 | No | ||
| 5 | PPP2R5D | 4010156 380408 5550112 5670162 | 3110 | 0.422 | 0.0132 | No | ||
| 6 | UBE2L3 | 1690707 5900242 | 3622 | 0.258 | -0.0056 | No | ||
| 7 | FYN | 2100468 4760520 4850687 | 4785 | 0.091 | -0.0651 | No | ||
| 8 | TH | 2100056 | 5147 | 0.069 | -0.0822 | No | ||
| 9 | PLD1 | 2450537 | 5369 | 0.060 | -0.0920 | No | ||
| 10 | PLCB2 | 360132 | 5506 | 0.055 | -0.0975 | No | ||
| 11 | CSNK2A1 | 1580577 | 5807 | 0.045 | -0.1121 | No | ||
| 12 | SYK | 6940133 | 6907 | 0.018 | -0.1707 | No | ||
| 13 | SRC | 580132 | 7737 | 0.003 | -0.2152 | No | ||
| 14 | SLC6A3 | 5720121 | 8420 | -0.008 | -0.2516 | No | ||
| 15 | LYN | 6040600 | 8816 | -0.015 | -0.2723 | No | ||
| 16 | YES1 | 6100050 | 9273 | -0.022 | -0.2961 | No | ||
| 17 | PLD2 | 2850097 | 9682 | -0.030 | -0.3171 | No | ||
| 18 | HCK | 4230592 | 12008 | -0.093 | -0.4390 | No | ||
| 19 | PARK2 | 2030053 2030452 3520594 4200136 | 12171 | -0.099 | -0.4444 | No | ||
| 20 | MAOB | 2970520 3060056 | 13197 | -0.166 | -0.4940 | No | ||
| 21 | KLK6 | 4010706 870026 | 13618 | -0.207 | -0.5096 | No | ||
| 22 | GRK5 | 1940348 4670053 | 14083 | -0.262 | -0.5257 | No | ||
| 23 | SNCA | 5340673 | 15821 | -0.747 | -0.5940 | No | ||
| 24 | STUB1 | 5860086 | 16689 | -1.258 | -0.5983 | Yes | ||
| 25 | PARK7 | 4560195 | 16872 | -1.415 | -0.5604 | Yes | ||
| 26 | LCK | 3360142 | 17025 | -1.510 | -0.5177 | Yes | ||
| 27 | FKBP1A | 2450368 | 17092 | -1.554 | -0.4689 | Yes | ||
| 28 | BLK | 1940128 5390053 | 17951 | -2.469 | -0.4319 | Yes | ||
| 29 | FGR | 3780047 | 18321 | -3.215 | -0.3434 | Yes | ||
| 30 | MAPK3 | 580161 4780035 | 18380 | -3.390 | -0.2323 | Yes | ||
| 31 | PTK2B | 4730411 | 18400 | -3.448 | -0.1172 | Yes | ||
| 32 | BAD | 2120148 | 18473 | -3.821 | 0.0077 | Yes |